9 Money Supply
In economics, money refers to the most liquid assets—assets that can readily be used to purchase goods and services. Liquidity differs across assets: cash is highly liquid, whereas selling an asset such as a house involves time and transaction costs. Consequently, economists use several monetary aggregates with different degrees of liquidity.
| Aggregate | Definition | Main idea |
|---|---|---|
| Monetary base (M0) | Currency in circulation + reserves held at the central bank | Central-bank money |
| M1 | Currency + checking deposits | Assets directly usable for payments |
| M2 | M1 + less liquid assets, such as savings deposits and money market mutual funds | A broader measure of money |
The monetary base and M1 are not the same: bank reserves are part of the monetary base, while checking deposits are included in M1.
9.1 Currency and the Monetary Base
9.1.1 Central Banks and the Monetary Base
Central banks can control the monetary base.
The monetary base has two components: currency and reserves. One might imagine that currency is the component central banks have the most control over. Central banks are the sole providers of currency, and when they supply it to a bank, they deduct the same amount from the bank’s reserve account.
However, in a modern economy, the amount of currency in circulation is driven by public demand. The Fed or ECB are not going to refuse to provide currency to banks to keep their ATM machines running, provided the banks have sufficient credit in their reserve accounts.
Thus, the way modern central banks control the monetary base is by controlling the quantity of reserves. Reserves can be controlled through open market operations:
- Buying securities increases the amount of bank reserves.
- Selling securities decreases the amount of bank reserves.
9.1.2 Transaction Usage Does Not Explain Amount of Banknotes in Circulation
Some maths: there are €1,610,000 million in banknotes in circulation, and the euro-area population is estimated at 343 million. That is an average amount of banknotes per person of €4,693.
Pretty clearly, people are not keeping that amount of money on hand for everyday transaction purposes.
Large banknotes (€100 or more) play a much greater role in the supply than one might imagine, accounting for about half the total value of banknotes in circulation.
ECB research, based on information about how often notes are returned to the central bank, estimates that:
- Only one quarter of the total value of banknotes in circulation is held for transactional purposes.
- Around 30% of the total value of banknotes in circulation is held outside the euro area.
- Up to 45% of the value of euro banknotes is held as a store of value (i.e., “mattress money”).
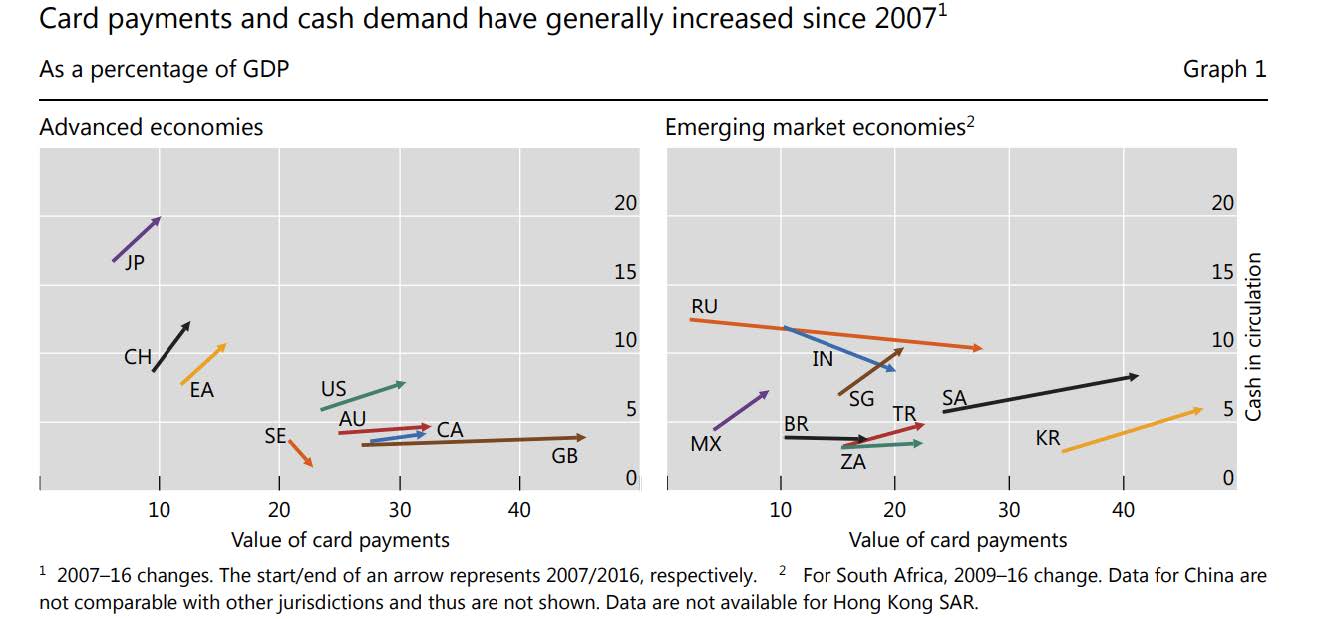
The chart reports that card payments and cash demand have generally increased since 2007. It compares the value of card payments (horizontal axis) and cash in circulation (vertical axis), both as percentages of GDP, in advanced and emerging market economies.
Source: BIS Quarterly Review, March 2018.
9.1.3 The Euro Changeover
An interesting incident occurred in the run-up to the euro changeover in 2002.
It is well known that much of the cash in circulation reflects “hoarded” cash, generally held in high denominations.
Imagine yourself in 2001, with a huge pile of 500 Deutsche Mark notes because you run what we might call “an informal business.” Would you have fancied walking into a bank in early 2002 to get the whole pile changed into euros?
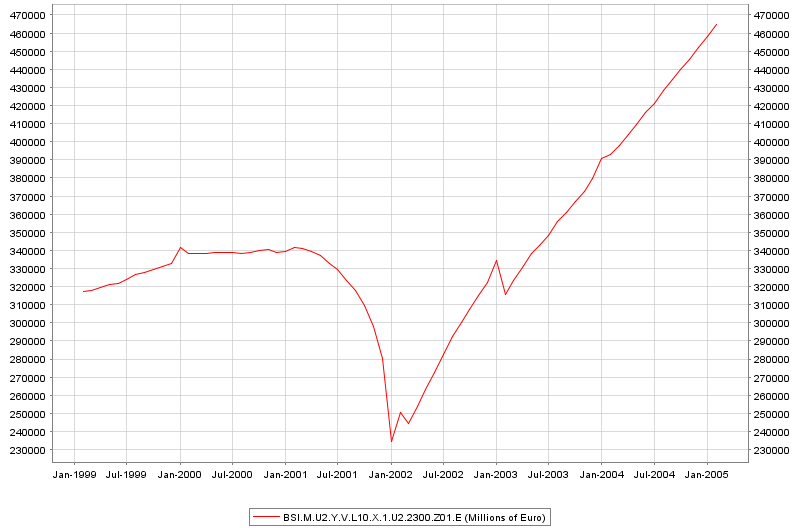
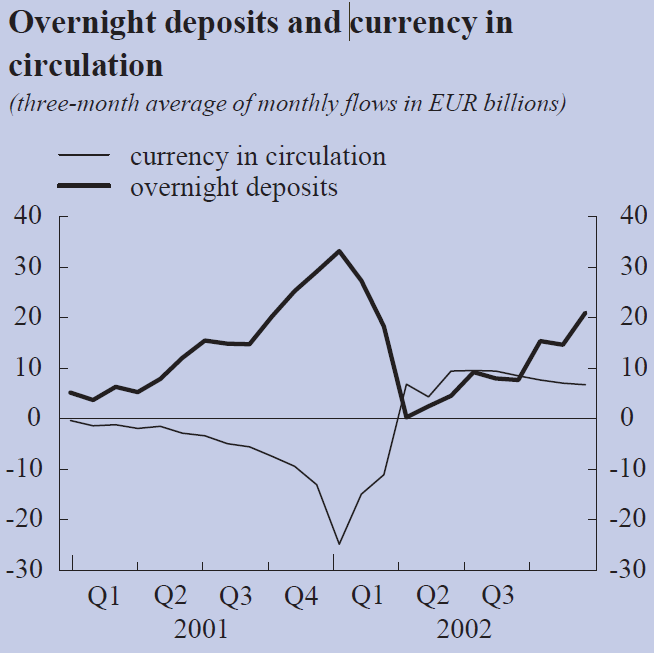
Hence, currency in circulation in the euro area gradually fell from €340 billion in January 2001 to €234 billion in December 2001, and then gradually recovered. Most of the cash taken out of circulation was deposited in banks.
There was a big decline and then a big increase in the average value of banknotes in circulation. (The lecture refers to an article on the ECB website.) The €500 note has been very popular with “informal” businesses.
The graph shows the sharp reduction in currency in circulation around the 2002 euro changeover, followed by a substantial recovery.
The chart compares overnight deposits and currency in circulation, measured as three-month averages of monthly flows in EUR billions. The fall in currency coincided with a large increase in overnight deposits.
The average value of banknotes in circulation fell sharply around the euro changeover and then rose substantially.
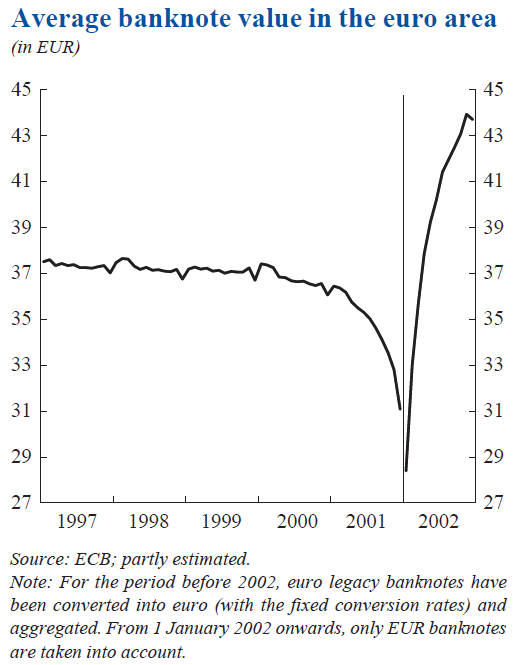
Source: ECB; partly estimated, as indicated in the original figure.
9.1.4 Large Increase of Currency in Circulation During the Pandemic
The FRED chart shows US currency in circulation (billions of dollars) from 1960 onward, including a pronounced increase during the COVID-19 pandemic.
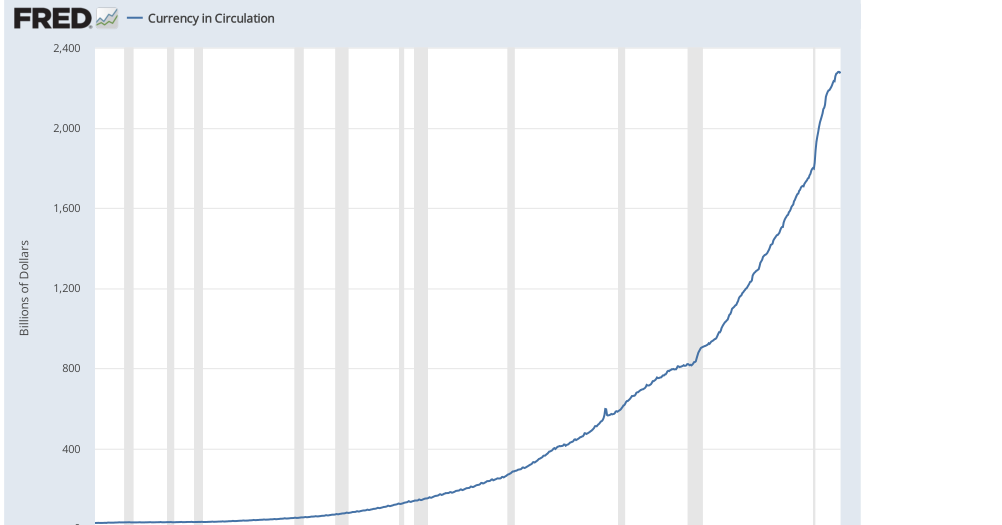
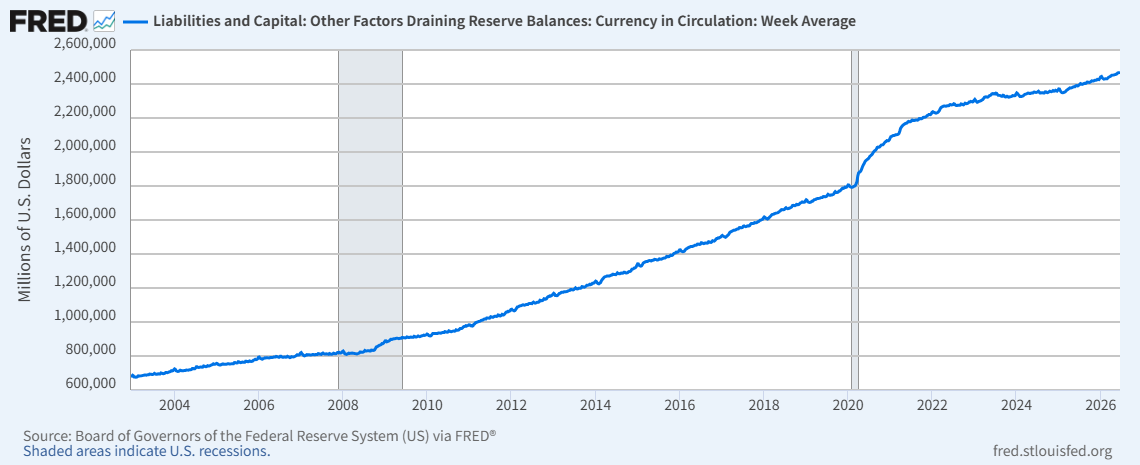
Source: Board of Governors of the Federal Reserve System (US), via FRED (fred.stlouisfed.org).
The euro-area series similarly shows an increase in currency in circulation during the pandemic.
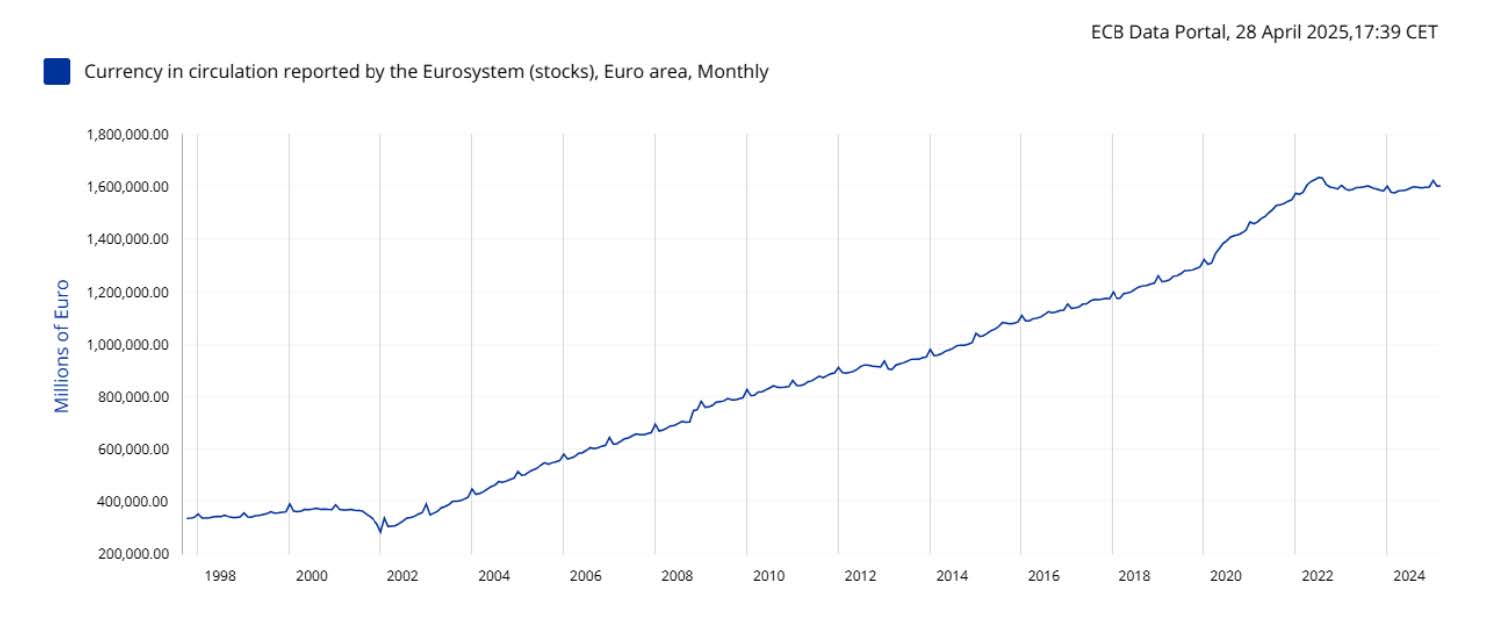
Source: ECB Statistical Data Warehouse.
The lecture emphasizes that the rise in the stock of currency in circulation reflected fewer banknotes being returned, not an increase in issuance: issuance was down.
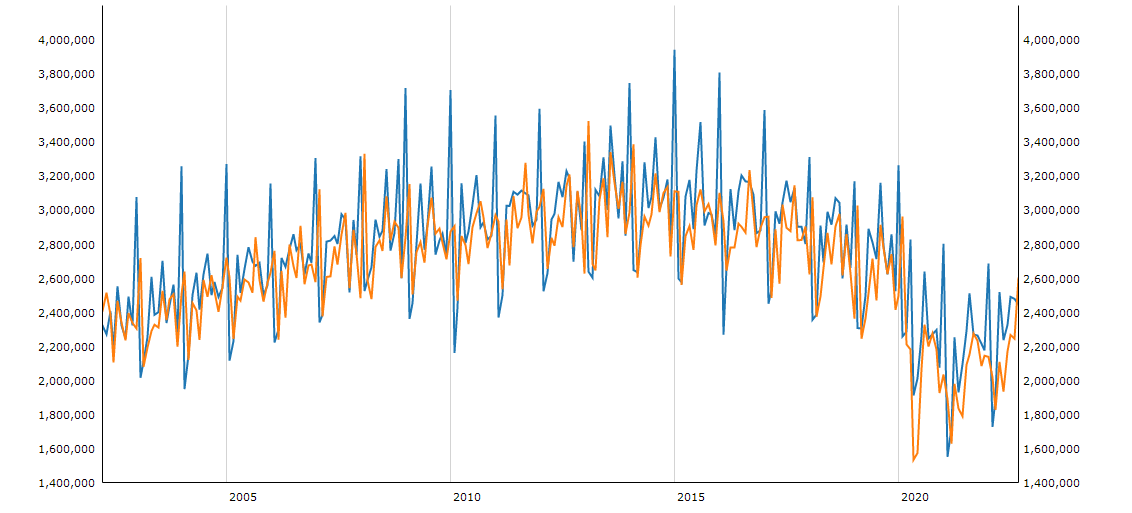
Source: ECB Statistical Data Warehouse.
9.2 The Money Supply and the Money Multiplier
We will now describe a simple model of how the central bank can control measures of the money supply, such as M1, by controlling the monetary base. Problems with this model are discussed in the next lecture.
Central banks do not have direct control over these aggregates. Here we describe how monetarists saw the relationship between the quantity of reserves and the M1 measure of the money supply.
9.2.1 Money Creation via loans
Let’s start by considering a very simple world where all banks are just starting up in business and do not yet have any sources of funds. Now suppose the central bank conducts an open market operation, buying a security so that deposits rise by $100. When the cheque is deposited, the central bank increases the bank’s reserves by $100.
First Bank’s Balance Sheet — Initial Position
| First Bank: Assets | Amount | Liabilities | Amount |
|---|---|---|---|
| Reserves | $100 | Deposits | $100 |
| Loans | $0 |
Suppose also that reserve requirements are 10% of deposits. Assume the bank wants to keep only the minimum required level of reserves and uses the rest of its available funds to make loans, which earn a higher rate of return. The bank lends out $90 and keeps the remaining $10 in reserves.
First Bank’s Balance Sheet — After Lending
| First Bank: Assets | Amount | Liabilities | Amount |
|---|---|---|---|
| Reserves | $10 | Deposits | $100 |
| Loans | $90 |
The person who received the $90 loan from the first bank deposits the funds at a second bank, which sees its deposits and reserves both credited by $90.
Second Bank’s Balance Sheet — Initial Position
| Assets | Amount (\() | Liabilities | Amount (\)) | ||
|---|---|---|---|
| Reserves | 90 | Deposits | 90 |
| Loans | 0 |
Notice that there are still $100 of reserves in the system: $10 at Bank A and $90 at Bank B.
Then Bank B decides to keep 10% of its deposits in reserves and loan out the rest, so its balance sheet becomes:
Second Bank’s Balance Sheet — After Lending
| Assets | Amount (\() | Liabilities | Amount (\)) | ||
|---|---|---|---|
| Reserves | 9 | Deposits | 90 |
| Loans | 81 |
You can probably see what is coming next. The person who received the $81 loan from the second bank deposits these funds at a third bank, which sees its deposits and reserves both credited by $81.
Third Bank’s Balance Sheet — Initial Position
| Assets | Amount (\() | Liabilities | Amount (\)) | ||
|---|---|---|---|
| Reserves | 81 | Deposits | 81 |
| Loans | 0 |
Again, there are still $100 of reserves in the system: $10 at Bank A, $9 at Bank B, and $81 at Bank C.
Then Bank C decides to keep 10% of its deposits in reserves and loan out the rest, so its balance sheet becomes:
Third Bank’s Balance Sheet — After Lending
| Assets | Amount (\() | Liabilities | Amount (\)) | ||
|---|---|---|---|
| Reserves | 8.1 | Deposits | 81 |
| Loans | 72.9 |
And so on. When the process is finished, the addition of $100 of reserves (remember, the increase in reserves was always $100) has been associated with an increase in deposits of:
\[ \$100 + \$90 + \$81 + \cdots = \$1{,}000. \]
How do we know the sequence adds to $1,000?
Let \(r\) be the reserve requirement ratio. After an initial increase of 1 in the monetary base, the subsequent increases are \(1-r\), \((1-r)^2\), \((1-r)^3\), and so on.
The total increase in the money supply is:
\[ 1 + (1-r) + (1-r)^2 + (1-r)^3 + \cdots. \]
Recall the geometric-series formula: if \(|c|<1\), then
\[ 1+c+c^2+c^3+\cdots=\frac{1}{1-c}. \]
Therefore, the increase in deposits is:
\[ \frac{1}{1-(1-r)}=\frac{1}{r} \]
times the initial increase. In the example, since \(r=0.10\):
\[ \Delta D = \frac{\$100}{0.10}=\$1{,}000. \]
We should not be too surprised. The central bank added $100 in reserves, and each bank sets reserves equal to 10% of deposits. The equilibrium involves an increase in deposits that is ten times the increase in reserves.
9.2.2 The Money Multiplier
The money multiplier is the ratio of the money supply to the monetary base. In this simple example, it equals:
\[ m=\frac{M1}{MB}=\frac{1}{r}. \]
The money multiplier is often misinterpreted.
In our example, the central bank starts by increasing deposits by $100, and the actions of the banking system end up increasing deposits by $1,000.
People sometimes think that individual banks can somehow take in $100 and then make an additional $900 in loans from this, creating funds out of nowhere. The lecturer argues that this would amount to lending funds they did not have, which would be fraud.
That is not what happens in this example. In each case, banks lend 90% of their deposits and retain the rest. They do not lend out amounts above those provided to them by depositors, which is their role as financial intermediaries.
When a person deposits $100 in cash in a bank, that bank can lend at most an additional $100. However, in a fractional-reserve system with a reserve requirement of 10%, $100 of reserves is consistent with $1,000 of total deposits.
9.2.3 Balance Sheet with Deposits Staying Within the Bank
In the previous example, money loaned to people was directly deposited in a different bank. If Bank A instead credited an account the borrower had at Bank A, its balance sheet would become:
First Bank’s Balance Sheet — Loan Credited to an Account at the Same Bank
| Assets | Amount (\() | Liabilities | Amount (\)) | ||
|---|---|---|---|
| Reserves | 100 | Deposits | 190 |
| Loans | 90 |
This looks different from before, but the end outcome would be the same.
- Most loans are issued for the purpose of spending on particular things. Why take out a loan just to leave it sitting in the bank on deposit, since this will lose you money? The money gets spent and ends up in deposit accounts at other banks.
- If, for whatever reason, the loaned money remained in the bank as deposits, a bank choosing to meet only the minimum reserve requirement (as assumed here) could use these reserves to make new loans, just as other banks did in the example.
9.2.4 Create Deposits
Notice something about the money multiplier story: Loans create deposits. Economists have been teaching this for a long time.
But people who argue that “banks are not financial intermediaries” often also say that “economists teach you that deposits create loans but it is really loans that create deposits.” The lecturer argues that this confuses different things.
At the level of an individual bank, economists usually do not teach that a loan first shows up as a deposit within the same bank. (This is the “loans creating deposits” step that, as the lecturer notes, is not usually taught in the introductory presentation, although he showed it here.)
There are good reasons for this teaching choice. Most of the money banks lend does not work this way: one needs to follow the initial step with the borrower spending the money, which most likely shows up in a different bank, just like the traditional story.
Individual banks are financial intermediaries and need deposits to issue loans.
But at the level of the banking system as a whole, loans create deposits.
9.3 Incorporating Currency and Excess Reserves
The previous example did not allow for the possibility that some loan proceeds would be withdrawn as currency, rather than just re-deposited in the banking system.
Now assume currency is a constant fraction \(c\) of deposits:
\[ C=cD. \]
The previous example also assumed banks would maintain a reserve ratio of \(r\). Banks may want to hold more reserves for precautionary reasons. Assume that reserves are:
\[ R=(r+e)D, \]
where \(e\) represents excess reserves as a fraction of deposits.
The monetary base is:
\[ MB=R+C=(r+e+c)D. \]
The M1 money supply is:
\[ M1=D+C=(1+c)D. \]
The money multiplier is thus:
\[ \boxed{m=\frac{M1}{MB}=\frac{1+c}{r+e+c}.} \]
The money multiplier gets smaller as \(e\) gets bigger. It also gets smaller as \(c\) gets bigger, provided \(r+e<1\) (which the lecture assumes will be the case).
9.4 Friedman and Schwartz on the Great Depression
Through careful collection of data that had not previously been available, Friedman and Schwartz’s famous 1963 study, A Monetary History of the United States, 1867–1960, showed that \(e\) and \(c\) increased during the Great Depression and that there was a sharp decline in the money multiplier.
The underlying cause was a banking crisis, which led to a lack of confidence in banks.
Depositors withdrew money from banks they viewed as perhaps not being safe, preferring to keep it as cash, and banks needed to keep large stocks of reserves in case they were hit by a bank run.
The Federal Reserve during the 1930s did not collect detailed monetary statistics and had not been aware that the money supply was sharply contracting.
Friedman and Schwartz attributed the decline in economic activity to the sharp contraction of the money supply.
The figure tracks the currency ratio \(c\) and the excess-reserves ratio \(e\) from 1929 to 1933. Both increased around the banking crises, illustrating the mechanisms described on Slide 25.
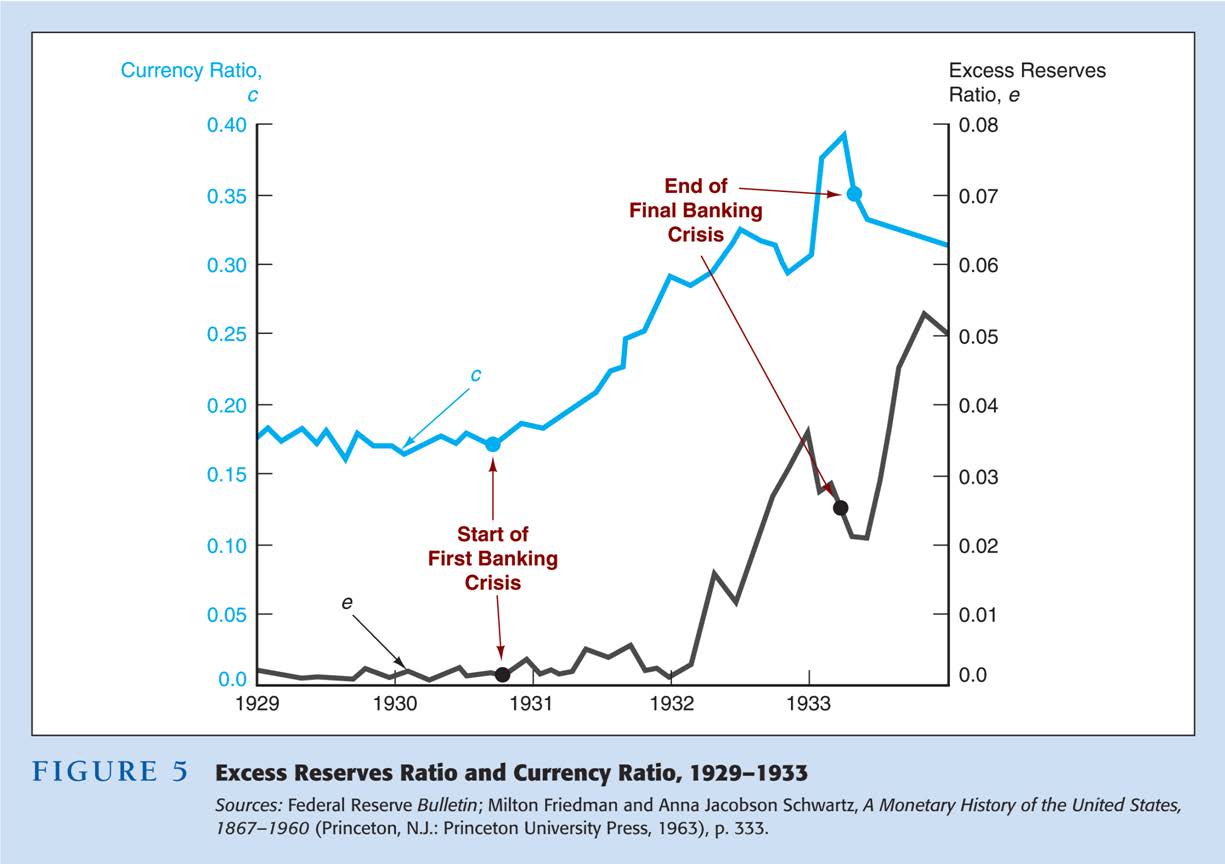
Source: Federal Reserve Bulletin; Milton Friedman and Anna Jacobson Schwartz, A Monetary History of the United States, 1867–1960 (1963), p. 333, as credited in the original slide.