13 Long-Term Interest Rates: Bonds and the Expectations Theory
We have discussed how central banks control short-term interest rates on sums that financial institutions lend and borrow at. These rates receive a huge amount of attention but economically they are not very important. The sums borrowed in these markets are small when compared with the amounts borrowed by businesses and governments via issuance of bonds or borrowing by households in the form of mortgages, car loans, credit card debt and so on.
Check out the Fed’s “Selected Interest Rates” release. As of October 20, 2025,
- The fed funds rate was at an annualised rate 4.11%,
- one-year Treasury securities would get you an interest return of 3.55%,
- the ten-year Treasury bond would get you 4% per year for the next ten years
- the thirty-year Treasury bond would get you 4.58% per year over the next thirty years.
Elsewhere, you can find out that on October 21
- AAA-rated corporate bonds had an average interest rate of 5.08%
- BAA-rated corporate bonds had an interest rate of 5.68%.
- The average 30-year mortgage interest rate was 6.27%.
What accounts for the differences between all these interest rates?
Generally speaking, there are three principal factors that influence the interest rate on a particular type of debt:
- Maturity: How much time does the borrower have to pay back? Interbank loans are often overnight but most business and consumer loans are for terms of years.
- Risk: Some types of debt (e.g. government bonds in certain countries) have very little risk of default. Others (mortgages, credit cards, corporate bonds) differ in the probability of default and in how much the lender will lose if there is a default.
- Liquidity: Debt instruments differ in how easily they can be traded. A bond for which a liquid market does not exist will probably have to pay out a higher interest rate to attract investors.
We will focus here on the first of these issues. We will look at how interest rates on assets with similar levels of risk and liquidity differ because of their varying maturity by focusing on the market for government bonds. We will discuss risk and liquidity later.
13.1 Bonds and Yields
The interest rates we will focus on in this lecture will be the interest rates associated with bonds. So what is a bond?
Bonds are a form of IOU issued by governments or corporations to people who provide them with money.
An investor agrees to provide the bond issuer (e.g. the government) with a sum of money, say $100. This sum is called the principal.
In return, the bond issuer provides the investor with a bond certificate that specifies how the money will be repaid. The terms of a bond contract specifies the length of time until the principal is repaid. This is known as the maturity of the bond. It may be that the final repayment exceeds the initial principal provided.
It also specifies a schedule for potential interest payments to be made. These are sometimes called coupon payments.
Bond certificates can generally be sold by the holder to other investors at any time. Indeed, while the stock market gets a lot of attention, the global bond market is a far larger and more important one than the stock market.
13.1.1 Definition of Yield to Maturity
Suppose you have $100 to invest. You decide to purchase a bond with price $100 that will pay you back $116 in five years time. Investors will tell you that your bond has a yield to maturity of 3% because
\[ \$100(1.03)^5 = \$116 \]
The investment turns out the same as investing at an interest rate of 3% and re-investing the proceeds until five years time.
An alternative way of writing this relationship is:
\[ \$100 = \frac{\$116}{1.03^5} \]
More generally, the price of a bond that pays out $1 in \(m\) periods time can always be expressed as
\[ P_m = \frac{1}{(1+y_m)^m} \]
Alternatively, we figure the yield from the current price:
\[ 1+y_m = \left(\frac{1}{P_m}\right)^{1/m} \]
13.1.2 Inverse Relationship Between Prices and Yields
Let’s still assume you’re still the guy who bought the bond that pays $116 in five years time. Now suppose something happens in financial markets, so that the yield on all bonds has to rise to 4%. If you had to sell your bond now, its price would have to be
\[ \frac{\$116}{1.04^5} = \$95.34 \]
This increase in yields may have been good news for new investors who just arrived in the market looking for the best possible return. But if you wanted to sell your bond today, it was bad news for you. The terms of your bond haven’t changed—it still only provides $116 in five years time—so to satisfy the new market-driven yield of 4%, you would have to sell your bond today for less than the $100 you spent to acquire it.
Key Point: Bond prices and bond yields move in the opposite direction.
13.1.3 Coupon Bonds
The previous example just given involves a bond that only pays out when it matures in five years time. It doesn’t make interest coupon payments along the way. This is known as a zero-coupon bond.
What about bonds that make interest coupon payments? One can calculate the yield for these bonds by viewing them simply as a series of zero-coupon bonds bundled together. For example, consider a bond that makes interest payments of \(C\) every period for ten years and then pays out \(F\) in the tenth year. We calculate the yield of the bond as the \(y\) that makes the following equation hold
\[ P = \frac{C}{1+y} + \frac{C}{(1+y)^2} + \frac{C}{(1+y)^3} + \cdots + \frac{C}{(1+y)^{10}} + \frac{F}{(1+y)^{10}} \]
For most bonds, the final payment at maturity and the amount of the coupons don’t change. However, the yield does change as bond prices move up or down.
The yield is thus a simple summary statistic that you can use to summarise the rate of return you can get from different types of bonds, whether they pay coupons or not.
13.1.4 Yield Curve
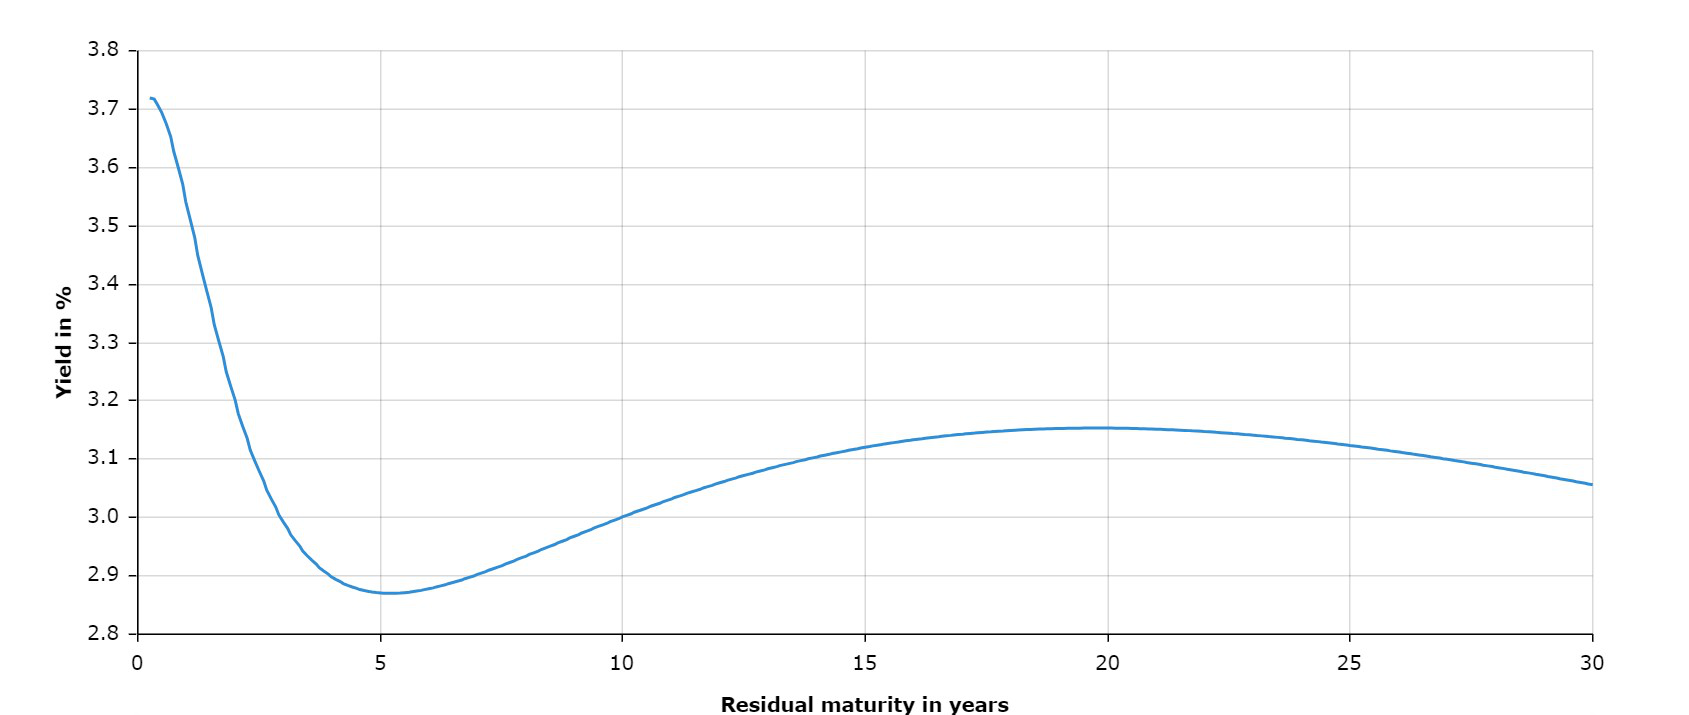
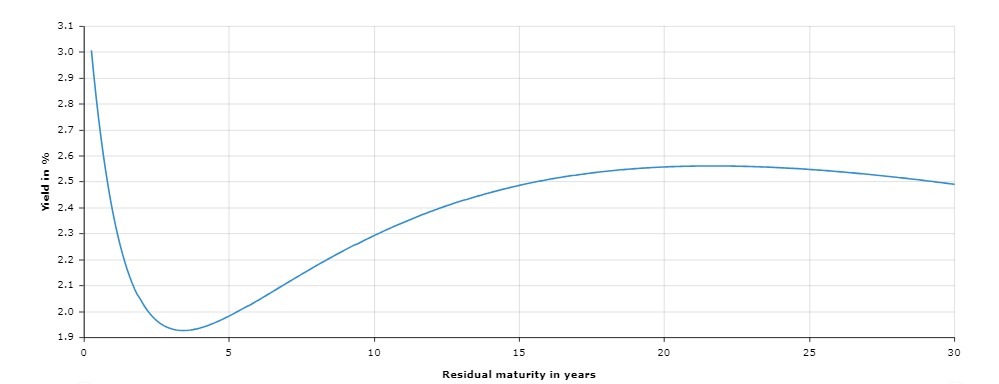
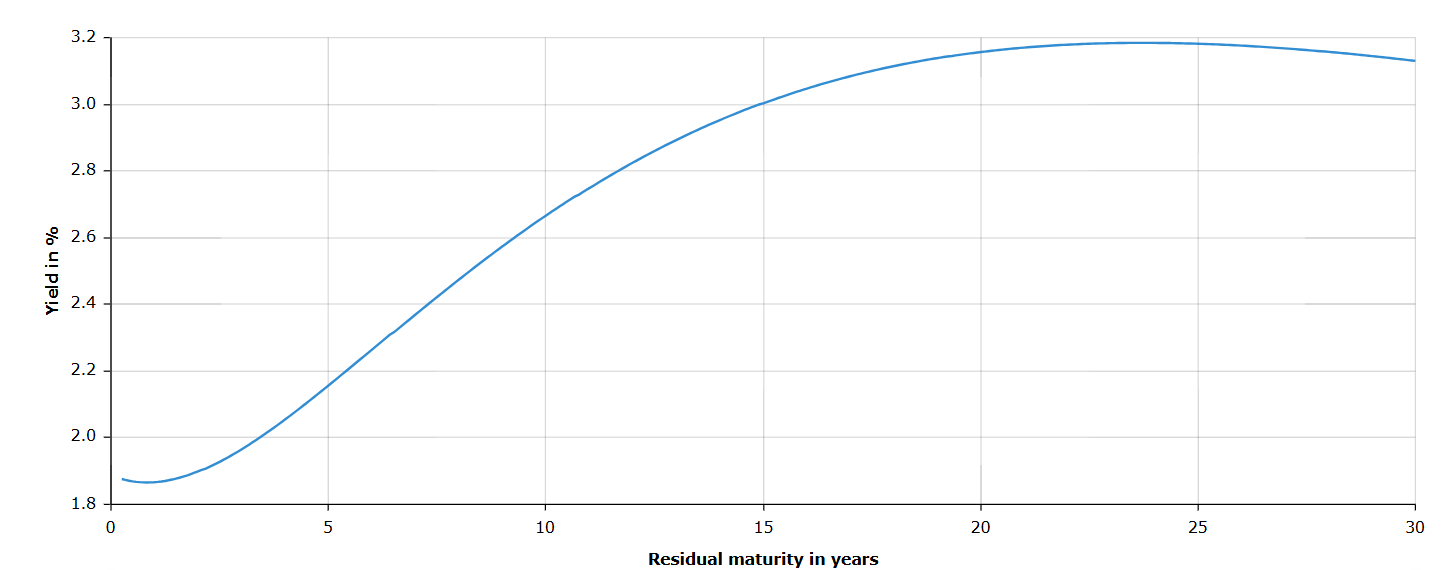
A nice way to summarise information about the yields available on bonds that have different maturities (i.e. that differ according to when their final payout occurs) is to chart the different yields on the y-axis while charting the maturity on the x-axis.
This line in this kind of chart is known as “The Yield Curve” and financial market participants pay close attention to it.
Getting information on yields on government bonds is really easy. Type “Yield Curve” into Google and you’ll find information on the yields at various maturities for Europe from the ECB and for the US from the US Treasury.
October 2023 Yield Curve for AAA-Rated Government Bonds
October 2024 Yield Curve for AAA-Rated Government Bonds
October 2025 Yield Curve for AAA-Rated Government Bonds
13.1.5 The Market for US Treasury Bonds
Much of the research on the behaviour of long-term interest rates has focused on the market for US Treasury securities. The US government borrows from financial markets, issuing bonds that may off at lots of different maturities: Short-horizons such as one to three months and long horizons such as ten to thirty years.
The market for these securities is enormous and highly liquid and because the default risk for the US government is considered to be low, you don’t have to take this factor into account.This means that we can ignore the risk and liquidity factors and look purely at how maturity affects the interest rate on an asset.
Treasuries are of interest beyond being a useful learning tool. They are a key benchmark for investments denominated in US dollars: They provide an alternative to lending over similar maturities to corporations or mortgage lenders and thus influence those rates.
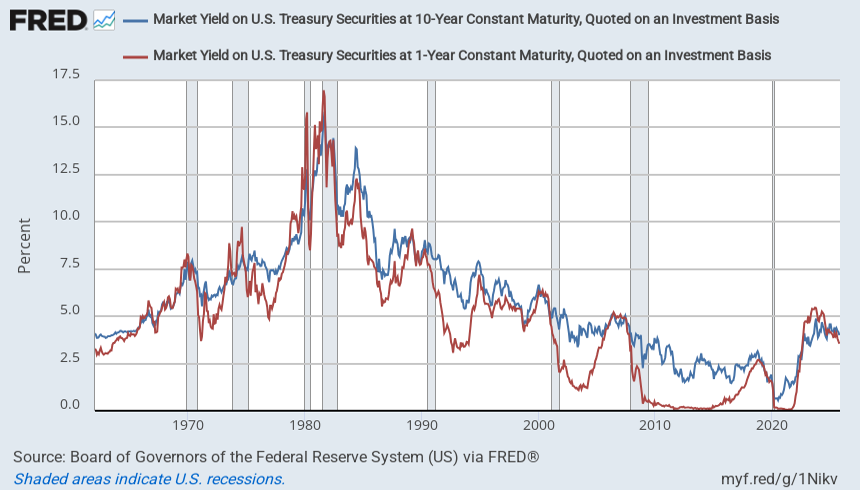
Market Yields on One-Year (Red) and Ten-Year (Blue) US Treasury Securities
13.1.6 Bond Market Stylized Facts
Several stylised facts characterise the bond market.
- Rates on longer-term bonds are usually higher than shorter-term bonds (i.e. yield curve usually slopes upwards.) Remember, the blue line for the ten-year interest rate was almost always higher than the black line for the one-year rate.
- Short and long rates often move in the same direction and interest rates on both short-term and long-term bonds are much lower today than in the late 1970s and early 1980s.
- But short rates are more variable than long rates.
- Short rates tend to draw close to long rates before and at the start of a recession and then the gap tends to widen again. In other words, the yield curve tends to flatten out just before recessions.
13.2 The Expectations Theory
Going back to the data from the Selected Interest Rates page, the one-year US Treasury bond has a current yield of 3.55% while the ten-year bond has a yield of 4%. You might think, at first look, that this means that you should choose to buy the ten-year bond instead of the one-year bond because it’s a better deal.
However, that’s not necessarily the case. After the one-year bond has matured, you have to re-invest the money again and yields on one-year bonds may go down in the future. You don’t know whether buying a sequence of one-year bonds over the next 10 years will be better or worse than buying a ten-year bond now.
Indeed, if investors really all thought that one type of bond strategy was much more profitable than another, then they’d all sell bonds associated with the bad strategy to buy the bonds associated with the good strategy. This would drive down the price of the bad-strategy bonds until the point where investors were indifferent.
This idea—that yields differ so as to make each investment strategy equally attractive—underlies what is called the expectations theory of the term structure.
13.2.1 Introducing The Expectations Theory
Suppose you have a choice between two different strategies for investing over two periods:
- Invest today at a fixed interest rate of \(i_{2t}\) per period.
- Invest today for one period at an interest rate of \(i_{1t}\), and then re-invest at next period’s one-year rate of \(i_{1,t+1}\).
For the two-period rate to be worth taking up, these two strategies must have the same expected return.
Two-period bond has cumulative return
\[ (1+i_{2t})^2 = 1+2i_{2t}+i_{2t}^2 \]
Rollover strategy has expected cumulative return
\[ (1+i_{1t})(1+E_t i_{1,t+1}) = 1+i_{1t}+E_t i_{1,t+1} +i_{1t}(E_t i_{1,t+1}) \]
For normal interest rates, both \(i_{2t}^2\) and \(i_{1t}(E_t i_{1,t+1})\) will be negligible.
So, theory implies
\[ i_{2t} = \frac{1}{2} \left( i_{1t} + E_t i_{1,t+1} \right) \]
The two-year rate is an average of the current one-year rate and the one-year rate expected a year from now.
We can apply this argument beyond two periods to get General Formulation of the Expectations Theory.
So, the three-period bond rate should be
\[ i_{3t} = \frac{1}{3} \left( i_{1t} + E_t i_{1,t+1} + E_t i_{1,t+2} \right) \]
and the four-period bond rate should be
\[ i_{4t} = \frac{1}{4} \left( i_{1t} + E_t i_{1,t+1} + E_t i_{1,t+2} + E_t i_{1,t+3} \right) \]
and the \(n\)-period bond rate should be
\[ i_{nt} = \frac{1}{n} \sum_{k=0}^{n-1} E_t i_{1,t+k} \]
The return on an \(n\)-period bond should equal the average of the return on one-period bonds over the \(n\) periods starting today.
According to this theory, an upward-sloping yield curve must mean that investors expect future short-term rates to be higher than today’s short-term rate. A downward-sloping yield curve would mean that investors think that short-term rates are going to decline in the future.
13.2.2 Explaining Some Facts with the Expectations Theory
The expectations theory helps to explain some of the facts we described earlier:
Long rates depend on current and expected future short rates, so if short rates are trending in one direction, we would expect long rates to also go in that direction: This explains why rates often move together.
But longer rates depend on expected short rates that may be far in the future. Today’s developments may have little effect on these expectations: Explains why long rates move less than short rates.
If people expect a recession, they will expect the central bank to cut interest rates. This can make long-term rates go down even if short-term rates have not yet been cut. This explains why the shape of the yield curve tends to change dramatically around recessions. More on this later.
But the theory does not explain why yield curve usually slopes up: We cannot always be expecting short rates to rise.
13.2.3 Monetary Policy and Forward Guidance
Rates on longer-term government bonds have a key influence on mortgage rates, corporate debt, etc. For instance, the ten-year Treasury rate is used as a benchmark for US fixed-rate mortgages.
Central banks control overnight interest rates. Long-term interest rates are influenced by the average of expected future overnight rates. So the expectations theory explains how the central bank influences all interest rates, not just short-term borrowing rates like the Fed Funds rate.
The theory also explains why forward guidance—central banks giving the public guidance on what they plan to do in the future—is an important part of monetary policy. When interest rates were near their lower limits for a long time, central banks could still influence long-term interest rates via forward guidance about the length of time they expected to keep short-term rates low.
Today, markets are less sure whether the major central banks will be raising or cutting interest rates next but they are always looking out for signals about the likely future direction of rates. Central bank communication strategies are a crucial part of monetary policy.