6 Incentive Problems in Banking
Why do banks get into trouble sometimes?
Our traditional image of a banker is of someone who is very conservative and risk-averse. Can’t we rely on the self-interest of conservative bankers to ensure that most banks maintain sufficient equity capital and that bank failure will be a rare event?
The answer is no. It turns out that the incentives of bank management can lead them to take risks that sometimes end up getting their banks into trouble.
We start by discussing how the personal financial incentives of bank executives can lead them to run banks that are too leveraged (i.e. too little equity capital relative to assets), have too many risky investments, and have too much short-term non-deposit funding.
In the language of microeconomics, the bankers do not take into account the negative externalities generated by their behaviour. Negative externalities of this sort are a classic example of when government intervention can improve economic outcomes. In this case, there is an argument for government regulation of the banking sector.
6.1 Example
We’ve discussed how banking works via a simple balance sheet listing assets and liabilities. To better understand how banks work, we’re going to go through a little exercise in which we imagine setting up a bank and figuring out what a bank CEO gets up to.
Let’s start with the assumption that the bank is founded by a bunch of investors who have €10 million. Then they hire you to run the bank for them. They expect you to make as much money for them on their investment as you can. Let’s see how it goes.
6.1.1 Getting Started
First thing you do is spend €1 million of your investors’ money on a retail branch network which can start to take in deposits. To attract depositors, you offer to pay 1% interest on deposits. Customers appear at the branches and next thing you know, you’ve got €50 million in deposits.
Flush with €59 million in non-property assets, you decide to use €50 million to make loans with an interest rate of 5% and you keep €9 million in cash and reserves (i.e. your account at the central bank).
Here’s how your balance sheet looks now (all figures in millions):
| Assets (Uses of Funds) | € million | Liabilities (Sources of Funds) | € million |
|---|---|---|---|
| Cash and Reserves | 9 | Deposits | 50 |
| Loans | 50 | Equity Capital | 10 |
| Branch Network Buildings | 1 | ||
| Total | 60 | Total | 60 |
6.1.2 The Income Statement
Now you’re in business. And like any other business, you have revenues and you have costs.
You have two types of revenues. Interest income of €2.5 million—5% of your €50 million in loans—and €1 million in fees from services offered by your branches.
However, you had to pay out interest of €0.5 million and the branch network costs €1.5 million to run.
Now you issue an Income Statement to your investors.
| Revenues | € million | Costs | € million |
|---|---|---|---|
| Interest Income | 2.5 | Interest Paid | 0.5 |
| Fees | 1.0 | Branch Network | 1.5 |
| Total | 3.5 | Total | 2.0 |
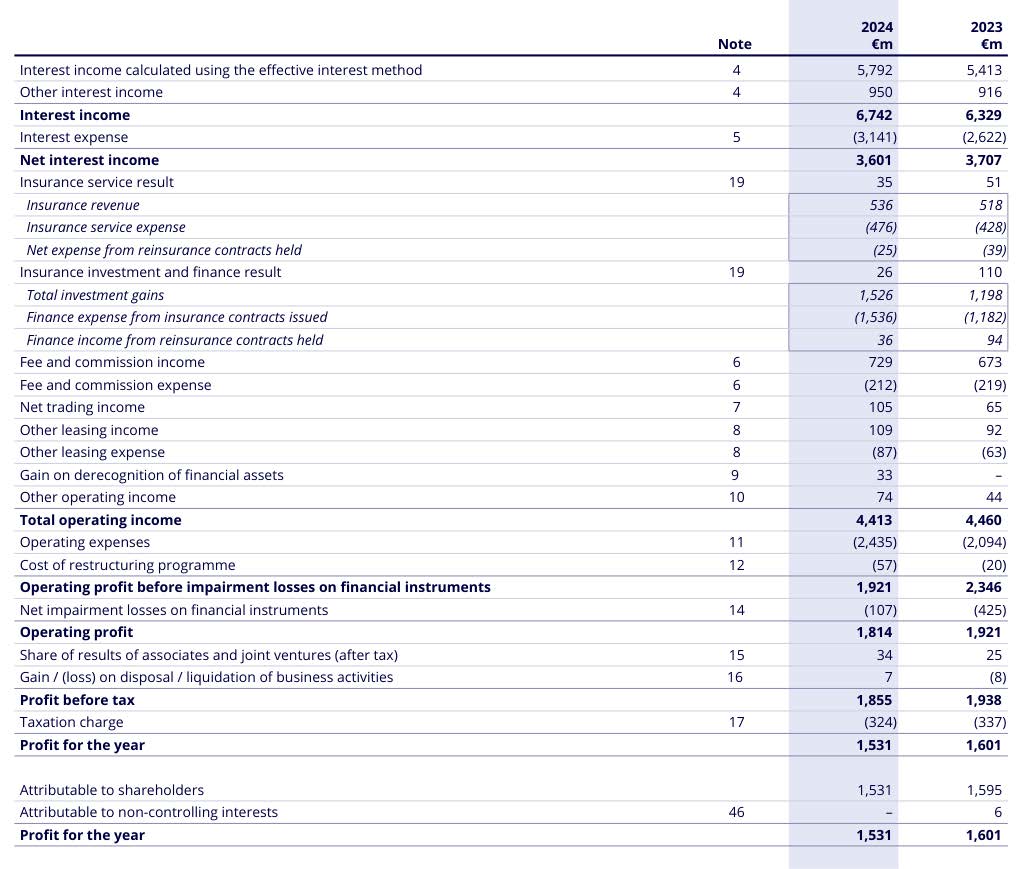
So, you’ve made profit of €1.5 million. Congratulations!
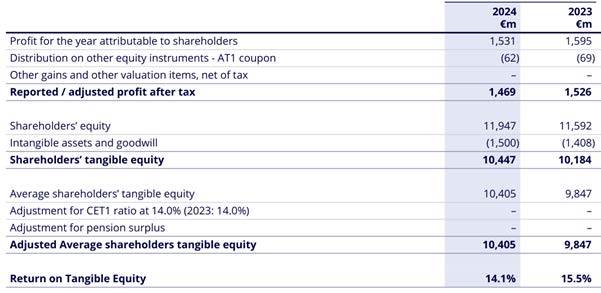
Your investors gave you €10 million and you made €1.5 million profit. Thus, you delivered a Return on Equity (ROE) of 15%. This is the key performance measure your investors will be watching.
6.1.3 Expanding the Business
What do you do with your €1.5 million of profit income?
You decide to pay €0.5 million back to your investors in dividends and use the other €1 million (retained earnings) to make more loans.
You also observe that there are opportunities to make more loans than your deposits and equity capital would allow, so you decide to issue €20 million in debt securities to raise funds to make these loans.
Now your balance sheet looks like this:
| Assets (Uses of Funds) | € million | Liabilities (Sources of Funds) | € million |
|---|---|---|---|
| Cash and Reserves | 9 | Deposits | 50 |
| Loans | 71 | Debt Securities | 20 |
| Branch Network Buildings | 1 | Equity Capital | 11 |
| Total | 81 | Total | 81 |
From here on, your goal is to expand the business and deliver a steady supply of dividends.
6.1.4 Credit Risk
But there’s a problem. Sometimes people don’t pay you back!
Suppose, for instance, that €5 million of your new loans of €21 million went to a dodgy property developer who went bankrupt and couldn’t pay you back.
Now your balance sheet looks like this:
| Assets (Uses of Funds) | € million | Liabilities (Sources of Funds) | € million |
|---|---|---|---|
| Cash and Reserves | 9 | Deposits | 50 |
| Loans | 66 | Debt Securities | 20 |
| Branch Network Buildings | 1 | Equity Capital | 6 |
| Total | 76 | Total | 76 |
Your assets only exceed deposits and debts by €6 million now.
Note the risky nature of equity capital. Your investors get dividends when you make profits but they are the first to lose their money if you make bad loans. Depositors and debt-holders have first claim for getting their money back. So you need to be very careful in assessing the credit risk on your loans.
6.2 Comparison: Aggressive and Conservative
Suppose you start up a bank with €10 million in equity capital. You pay 2% on deposits, charge 3% on your loans, and reserve requirements are 10% of deposits.
Consider now the following two cases. In the first case, you raise €90 million in deposits giving you the following balance sheet:
| Assets (Uses of Funds) | € million | Liabilities (Sources of Funds) | € million |
|---|---|---|---|
| Cash and Reserves | 9 | Deposits | 90 |
| Loans | 91 | Equity Capital | 10 |
| Total | 100 | Total | 100 |
In the second case, you are more aggressive raising funds. You also borrow €100 million from international money markets, again at 2% interest, giving you the following balance sheet:
| Assets (Uses of Funds) | € million | Liabilities (Sources of Funds) | € million |
|---|---|---|---|
| Cash and Reserves | 9 | Deposits | 90 |
| Loans | 191 | Borrowings | 100 |
| Equity Capital | 10 | ||
| Total | 200 | Total | 200 |
What profits do you make in these two cases?
Case 1: Profits = \(0.03(91)-0.02(90)=2.73-1.8=0.93\). Your Return on Equity is 9.3%.
Case 2: Profits = \(0.03(191)-0.02(190)=5.73-3.8=1.93\). Your Return on Equity is 19.3%.
The second case, with the lower capital-assets ratio, produces profits and thus a higher return on equity.
The capital-assets ratio is often discussed in reverse terms, as the assets-capital ratio, which is called the leverage ratio.
In Case 1, equity capital was 10% of total assets, so the leverage ratio was 10.
In Case 2, equity capital was 5% of total assets, so the leverage ratio was 20.
Clearly, the more highly-leveraged bank is taking on greater risk. It has more credit risk (more loans that could go bad) and more liquidity risk (funds from international money markets could dry up if things go wrong). But it also makes more profits.
6.3 Incentives of Bank Shareholders and CEOs
These calculations show why we can’t rely on bankers self-interest to maintain sufficient capital to protect against losses. The higher credit and liquidity risk means higher bank profits.
There are two different elements to consider here:
Investor Incentives: People differ in how much risk they are willing to take. Shareholders of a highly-leveraged bank may be willing to accept a risk of losing all their money in return for a high return most of the time. Maybe by the time the bank blows up, they will have made a nice return from all the dividends the bank has paid back.
Bank CEO Incentives: Even if the bank’s shareholders don’t want to take on a lot of risk, there are strong incentives for bank CEOs to operate with high leverage. Profit-linked bonuses are very important for senior bank management, so they want to maximize profits today. If the bank blows up next year, they don’t have to pay the bonuses back. So they have an incentive to take big risks while pretending to shareholders that they are being prudent.
6.3.1 Incentives to Take Excessive Risk in Lending or Investment
We have seen how banks may be incentivised to have too much leverage. For a given amount of equity, a bank with more assets will generally deliver a higher return on equity. For bank CEOs, the higher returns from more leverage may matter more than the smaller probability that credit or liquidity risks bring down the bank.
Similar arguments apply to risky lending or investments. Consider an investment that has a ninety percent probability of delivering a 50% return and a 10% probability of losing all your money. A banker who takes on this risk will generally do well and may earn good bonuses. Occasionally, however, his bank will become insolvent. He may decide it’s worth the gamble.
Sometimes bankers get into trouble because everyone believes a certain type of investment (technology stocks, housing) is a “one-way bet” and only realise too late that they are wrong.
Why don’t the bankers question the prevailing wisdom? Often, the money being made is just too good. Also, recall Keynes’s comment:
“A ‘sound’ banker, alas! is not one who foresees danger and avoids it, but one who, when he is ruined, is ruined in a conventional and orthodox way along with his fellows, so that no one can really blame him.”
6.3.2 Incentives to Rely on Short-Term Debt
By September 2007, it was clear that some major banks were going to incur large losses that would threaten their solvency. Many of them had funded their operations with very short-term borrowing, which began to flow out.
See paper by Diamond and Rajan:
“Given the complexity of bank risk-taking, and the potential breakdown in internal control processes, investors would have demanded a very high premium for financing the bank long term. By contrast, they would have been far more willing to hold short-term claims on the bank, since that would give them the option to exit – or get a higher premium – if the bank appeared to be getting into trouble.” In other words, they took this option because it was cheap.
Vanity Fair article on Bear Stearns
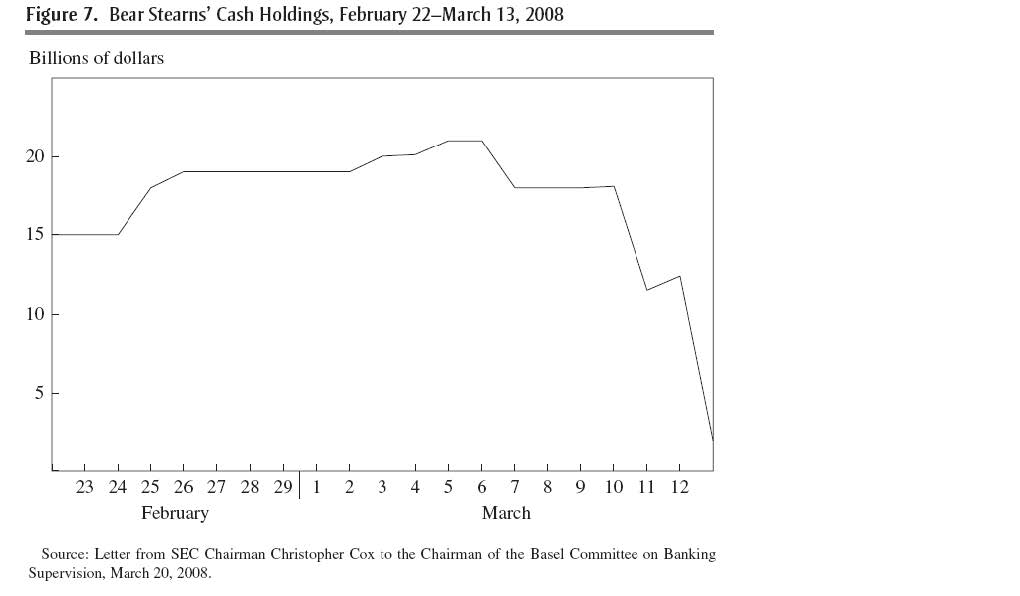
“By midafternoon the dam was breaking. One by one, repo lenders began to jump ship. As word spread of the withdrawals, still more repo lenders turned tail …. A full $30 billion or so of repo loans would not be rolled over the next morning. They might be able to replace maybe half that in the next day’s market, but that would still leave Bear $15 billion short of what it needed to make it through the day … By four o’clock the firm’s reserves, which had been $18 billion that Monday, had dwindled to almost nothing.”
6.3.3 Incentives to be Too Big
Previously, we discussed the idea of systemic risk, i.e. how a bank may be perceived as “too big to fail” because its failure can bring down the whole financial system.
This provides an incentive for banks to grow bigger in size over time: The bigger they are, the more likely the state will intervene to save them if things go wrong. In addition to being highly leveraged (high ratio of assets to equity) this can also be achieved by taking over other banks or seeking new equity investments.
In 2009 paper from November 2009 titled “Banking on the State” Piergiorgio Alessandri and Andrew Haldane of the Bank of England documented how banking sectors had grown in size relative to the economy, had become more leveraged and less liquid, and had engaged in more risky trading activities.
Some quotes from the paper are on the next few pages.
“Gains to shareholders are potentially unlimited. But the same is not true in bad states of the world. The reason is limited liability. That constrains the losses of shareholders to around zero. Losses beyond that point are borne by other parts of banks’ capital structure - wholesale and retail depositors. Therein lies the problem. If protection of depositors is felt to be a public good, these losses instead risk being borne by the state, either in the form of equity injections from the government (capital insurance), payouts to retail depositors (deposit insurance) or liquidity support to wholesale funders (liquidity insurance). The gains risk being privatised and the losses socialised. Evidence suggests this is a repeated historical pattern.”
“Socialised losses are doubly bad for society. Taxes may not only be higher on average. They may also need to rise when they are likely to be most painful to taxpayers, namely in the aftermath of crisis. So taxes profiles will be spiky rather than smooth and will spike when the chips are down.”
“So far, so bad. But it is about to get worse, for this tells only half the story. This is a repeated game. State support stokes future risk-taking incentives, as owners of banks adapt their strategies to maximise expected profits. So it was in the run-up to the present crisis.”
Alessandri and Haldane: The Doom Loop
“These strategies are the latest incarnation of efforts by the banking system to boost shareholder returns and, whether by accident or design, game the state. For the authorities, it poses a dilemma. Ex-ante, they may well say ‘never again’. But the ex-post costs of crisis mean such a statement lacks credibility. Knowing this, the rational response by market participants is to double their bets. This adds to the cost of future crises. And the larger these costs, the lower the credibility of ‘never again’ announcements. This is a doom loop.”
6.3.4 Incentive Problems with MBS
We described before how poorly performing subprime mortgage-backed securities (MBS) played a key role in the global financial crisis of 2008/09. This crisis was partly due to various parties having incentives that aligned badly with the MBS being of good quality.
Appraisers: Many mortgages came with reports appraising the properties as having higher value than they were worth. The banks making the loans (the originators) wanted reports showing the houses had high value (to make the loan-to-value ratios lower, so the mortgage seemed safer). So to keep getting business, appraisers inflated valuations.
Originators: The banks that made the original loans would then sell these mortgage assets to the underwriters, large investment banks that would bundle the mortgages together and create the MBS. They made money off fees from the originators and cared about those fees, not whether the mortgages were poor quality.
Underwriters: They made money from selling the MBS to investors and did not always care much about the quality of the product.
Ratings Agencies: These got paid by the underwriters and so they had incentives to claim the MBS were safer than they actually were.
6.4 The Need for Regulation
We have seen how, left to make their own decisions, bankers will chose to take too much risk. This means that banking crises are not just unfortunate accidents that are an unhappy by-product of the fractional reserve banking system.
Rather, most banking crises stem from bankers making decisions that prioritise their short-run profits over the long-run stability of the banking system and the economy. This means that banks need to be regulated by the government.
We will discuss banking regulation next.